

Accreditation

ALA
The Master of Library and Information Studies (MLIS) program at UNC Greensboro is fully accredited by the American Library Association (ALA). Accreditation was granted on June 25, 2018, affirming the program’s commitment to excellence in library and information science education. The next comprehensive review is scheduled for 2026.
Review our assessment information to learn more about our student achievement data.
CACREP
The counselor preparation programs within the Department of Counseling and Educational Development are CACREP (Council for Accreditation of Counseling and Related Educational Programs) accredited and offer excellent training through the Master’s and Doctoral Degrees.
Review our CACREP Annual Program Evaluation to learn about timely completion rates, licensure/certification exam pass rates, and job placement rates.

CAEP
UNC Greensboro is accredited under the Council for the Accreditation of Educator Preparation (CAEP) Standards at the Initial and Advanced levels through Spring 2029. The next site review will take place in Fall 2028.
CAEP
Professional Education Data
This set of assessments aligns to CAEP Annual Report Measure 1: Completer Effectiveness (Component R4.1).
The graph below shows data collected on beginning teachers (3 years of service or less) in public schools in North Carolina. The bars show the percentages of P-12 students taught by beginning teachers who do not meet, meet, or exceed their expected growth in learning for that year. The graph below shows the most recent data available to us as of April 2025.
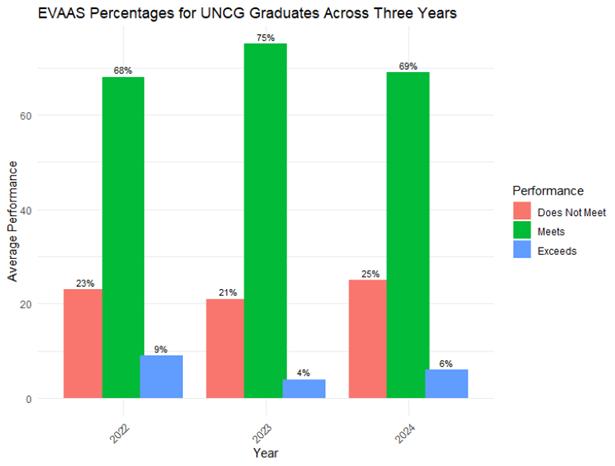
The graph below compares the data for UNCG graduates to the state data. In the most recent year (2024), UNCG had a lower percentage of completers who met and exceeded expected growth than the state. Overall, UNCG’s percentage of completers who met or exceeded expected growth was 75%. Year after year, the impact of UNCG graduates remains relatively consistent, although there has been a slight drop in the percentage of graduates meeting and exceeding expectations in the most recent year.

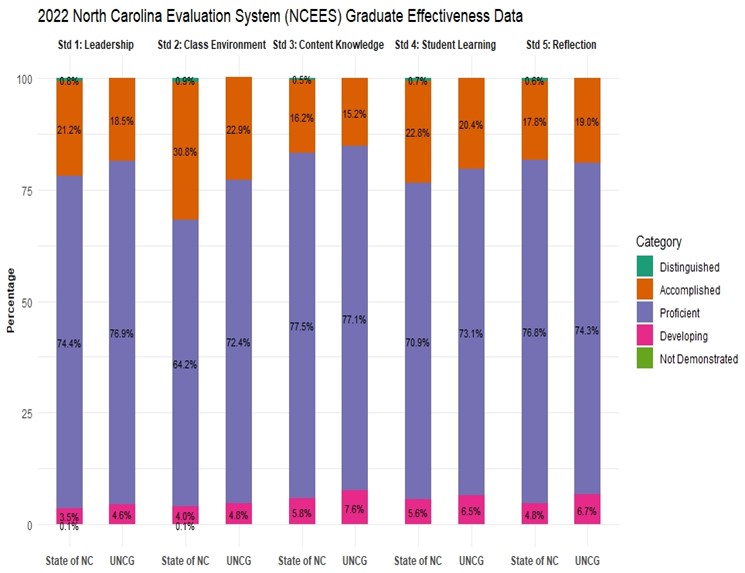
This set of assessments aligns to CAEP Annual Report Measure 1: Completer Effectiveness (Component R4.1).
The graphs show data collected on beginning teachers (3 years of service or less) in public schools in North Carolina. The bars show the percentage of UNCG alumni that are rated at each level on key performance areas compared to all beginning teachers in the state. The performance ratings are made by the principal. The key performance areas are aligned to state teaching standards:
- Standard 1: Teachers Demonstrate Leadership
- Standard 2: Teachers Establish a Respectful Environment for a Diverse Population of Students
- Standard 3: Teachers Know the Content They Teach
- Standard 4: Teachers Facilitate Learning for Their Students
- Standard 5: Teachers Reflect on Their Practice
The graphs below show the most recent three years of data available to us as of April 2025 (from AY 2021-22, 2022-23, and 2023-24).


1.0 Background
In alignment with the North Carolina Graduate Teaching standards, the UNCG School of Education office of Educational Assessment conducted a pilot survey in February 2023 to assess how participants in the TEHE MED program demonstrate competencies in various aspects of each of the five standards. The survey was administered to 21 respondents who serve as principals and employers where the participants currently work. However, five out of 21 employer email addresses bounced, leaving the pilot survey with a sample of 16 total respondents. Of these, 11 respondents successfully completed the survey, resulting in a response rate of 68.75%. This report summarizes the pilot survey instrument, analyzes the major findings of the pilot study, and provides recommendations for future surveys or studies using the same methods.
2.0 TEHE MED Participants’ Employers Pilot Survey
2.1 Analysis of the Pilot Survey Instrument
The survey instrument comprised 36 items aimed at assessing participants’ competencies in the five NC Graduate Teaching standards as evaluated by their employers in their day-to-day teaching activities. The instrument consisted of Likert scale items as well as open-ended questions. The items were straightforward, providing respondents with sufficient information regarding the aspects of the standards that assessed how well participants were prepared in each of these areas.
2.2 Analysis of the Pilot Survey Findings
Overview
Generally, the overall ratings suggest that all participants in the TEHE MED program were well-prepared in each of the five NC Graduate Teaching Standards, as none of them were rated as “somewhat unprepared” or “not at all prepared.” The analysis shows that the majority of participants were rated as extremely well prepared, and a few participants were rated as well prepared in all responses.
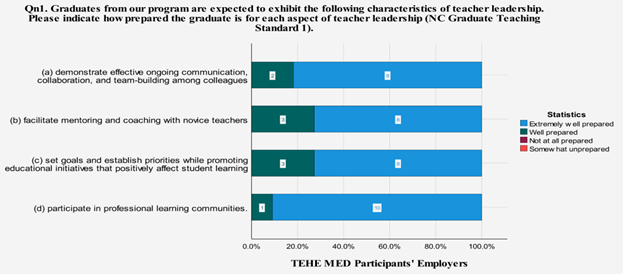
Analysis of Major Findings
The findings suggest that the participants of the UNCG TEHE MED program are very competent in various aspects of teaching; however, there exists a disparity in their level of competence across different aspects of each standard (See Appendix 1). For example, in the first standard that assesses participants’ display of leadership characteristics, over 90% of participants are exceedingly competent in their involvement in professional learning communities, followed by their demonstration of effective ongoing communication and collaboration among colleagues by 81.82%. Conversely, the participants who were extremely well prepared in facilitating mentoring for novice teachers and in establishing priorities and promoting educational initiatives that affect students learning positively were only 72.73% (See Figure 1 below). We observe a similar trend in the second standard, which evaluates the attributes of a respectful educational environment in participants (refer to Figure 2 in Appendix 1).
It is noted also that one item in the third Graduate Teaching Standard showed significant variation compared to all the other items. Specifically, respondents rated participants’ integration of 21st century content into educational practice as nearly split in half (5 out of 11 respondents rated participants as extremely well prepared, while 6 out of 11 rated them as not extremely well prepared), indicating that almost half of the participants (i.e., 45.45%) may not be as well prepared to model the integration of 21st century content and skills into educational practice. On a positive note, over 80% of respondents noted that participants demonstrated in-depth knowledge of curriculum, instruction, and assessment, and 72.73% rated participants as extremely well prepared in developing relevant and rigorous curriculum (See Figure 3 below).

A trend similar to this is noticed in the fourth standard, which evaluates participants’ preparedness in various aspects of student learning (See Figure 4 below). Just 63.6% of the participants are exceedingly competent in seeking out and utilizing existing research to inform school practices, and in designing action research to improve student learning and school policies and practices. This implies that almost 36.4% of the participants may not be as strong in these domains. However, in the same fourth standard, over 90% of the participants exhibit a remarkable level of competence in modeling technology integration to support student learning. Additionally, 72.7% of the participants possess the ability to critically analyze student and school performance data to ascertain needs and plan rigorous, coherent, and substantial instruction.

3.0 Conclusion and Recommendations
The pilot survey was conducted to a small number of people, and it received a considerable response rate. Findings from a pilot survey has revealed the effectiveness of the TEHE MED program in preparing its graduate teaching participants. Furthermore, the survey has identified some areas that require improvement or attention when designing the curriculum and lessons for the program participants. While the ratings were consistent across all items, indicating that the majority of program participants are highly skilled in the five teaching standards, the small sample size makes it challenging to determine the reliability of the pilot survey results. Therefore, considering the encouraging response rate, it is recommended that the office of Educational Assessment employ other qualitative methods, e.g., employer in depth interviews and/or focus group discussions to gather an in-depth understanding of the participants’ preparedness in the 5 standards. This will improve the validity and reliability of the pilot survey findings and, as a result, improve the program and its future undertakings.
UNCG Educator Preparedness
2025 Interview Report
Prepared for Dr. Christina O’Connor
Prepared by Dr. Tiffany Tovey and the OAERS Seminar Class, Spring 2025
Oluchi Anyaibe, Mercy Blematessa, Hannah Johnson, Bradley Madden, Eunice Oduro, Siphelele Qwabe, Brian Strickland, and Tippu Sultan
UNCG Educator Preparedness
2025 Interview Report
Purpose of this inquiry
The Office of Assessment, Evaluation, and Research Services at the University of North Carolina at Greensboro conducted an evaluation study to gather qualitative evidence on employer satisfaction with the preparation and performance of UNCG School of Education graduates from advanced-level educator preparation programs. This effort responds to Council for the Accreditation of Educator Preparation Standard A.4.1, which requires educator preparation providers to demonstrate that employers find program completers adequately prepared for their assigned responsibilities. Findings will inform both accreditation reporting requirements and ongoing programmatic improvement efforts across advanced licensure pathways.
Questions guiding the inquiry
We were interested in answering the following evaluation questions:
- What are school leaders’ perceptions and experiences regarding how well UNCG graduates are prepared for the demands of teaching?
- Based on school leaders’ perspectives, what improvements should be made to UNCG’s teacher preparation programming to better support future graduates?
Method: What did we do?
This study employed a qualitative interview process with principals and supervisors as the primary method of data collection to yield rich, actionable insights. We developed a semi-structured qualitative tool to gather perceptions about the effectiveness and readiness of graduates from the University of North Carolina at Greensboro’s (UNCG) advanced teaching programs. The protocol was developed for use with school-based personnel (e.g., principals, supervisors) who have directly worked with program graduates. The entire OAERS Seminar class assisted with data collection for this project (n = 8) as a part of a practical experience for learning more about the practicalities of qualitative inquiry. Graduate assistants worked in pairs to conduct the interviews, take notes, clean the data, and review, summarize, and synthesize the findings.
During the interview, we first oriented the conversation by inviting participants to describe their role and their school context, including how they have interacted with the UNCG graduate(s) in question. The core of the interview focused on the employer’s assessment of the graduate’s readiness for advanced teaching responsibilities. Participants were encouraged to reflect on specific strengths, areas of effective preparation, and any challenges or gaps they have observed.
Midway through the interview, participants were shown a screen with the five professional standards that guide advanced teacher preparation in North Carolina: (1) Teacher Leadership, (2) Respectful Educational Environments, (3) Content and Curriculum Expertise, (4) Student Learning, and (5) Reflection. These standards served as both a reflective prompt and a framework for deeper discussion. Participants were asked whether any of the standards resonated, either as particular strengths or areas needing growth, and to share examples that bring these standards to life. The interview concluded by asking about broader challenges faced, recommendations for improving teacher preparation, and any additional reflections the participant had.
Interview participants
We received a list of 13 employers’ emails from Dr. Christina O’Connor of MEd and Add-On candidates who graduated between Fall 2022 and Spring 2024, along with the associated UNCG graduate(s) that were employed in their school. These 13 employers represented 15 total graduates, including six masters degree graduates and nine add-on licensure recipients. Of this initial list, we reached out via email three times to each employer, resulting in six total interview conversations with employers that represent Guilford County Schools (n=2), Rockingham County Schools (n = 1), Currituck County Schools (n = 1), Rowan-Salisbury Schools (n = 1), and the North Carolina Cyber Academy (n = 1). Of the six principals, three represented elementary schools, two represented middle schools, and one represented the Cyber Academy.
Analysis and findings
The OAERS Seminar students cleaned and reviewed the data, created targeted summaries of the data based on our evaluation questions, and then reviewed the summaries, comparing each participant’s perspective to the other in order to provide a comprehensive, detailed narrative regarding teacher preparedness for graduates of UNCG and areas to consider as we refine our programming at the University in the future. In analyzing the data from the interviews, it became apparent that the responses about improvements that should be made to programming were referring broadly to UNCG’s teacher preparation programs rather than to the advanced preparation programs that specifically prepared the candidates they supervised. In future iterations of this process, we will revise the protocol to focus the questions more specifically on the programs in question. Findings are organized based on evaluation question in the pages to follow.
FINDINGS
What are school leaders’ perceptions and experiences regarding how well UNCG graduates are prepared for the demands of teaching?
School leaders perceive UNCG graduates as highly prepared for teaching, praising their skills, mindset, and leadership qualities.
Across the interviews, principals offered enthusiastic praise for UNCG graduates, frequently affirming that the teacher preparation program equips candidates with the skills, mindset, and leadership needed for success in diverse school contexts. Graduates were consistently described as well-prepared, particularly in areas such as curriculum knowledge, lesson planning, instructional delivery, and alignment with state standards. In this section, we first outline school leaders’ perceptions of graduates’ preparedness through the five North Carolina teaching standards, then we highlight two additional competencies that surfaced through our interviews. We end this section with challenges that graduates are facing in NC classrooms, according to our interviewees.
UNCG preparedness through the five standards
Teacher Leadership: Many school leaders recognized the leadership qualities of UNCG graduates, noting their ability to support colleagues and take on leadership roles within the school. Graduates were praised for their contributions to school-wide initiatives, such as PBIS Committees and mentorship programs.
In terms of interpersonal skills, graduates were recognized for their humility, reliability, and emotional intelligence, building meaningful connections with students and offering support to beginner teachers. One participant noted the emotional and morale-based mentorship a graduate provided, sharing that she is “very good at her teacher leadership because she in, in addition to being caring to the kids she cares about the school as a whole and cares about the BTs as people.”
Respectful Educational Environments: The respectful educational environments standard stood out most consistently across interviews. Many principals emphasized the graduates’ ability to form meaningful relationships with students, parents, and colleagues. This includes effective communication and engagement with families. Graduates were praised for fostering inclusive and supportive classroom cultures, ensuring that all students feel valued and respected. A principal recounted, “She communicates with her families a great deal, great communication via Class Dojo. She also has their telephone numbers, she’s not afraid to call them to share growth and also share areas of need.” The graduate’s commitment to fostering a respectful and inclusive classroom was evident in her proactive communication with parents and her intentional efforts to involve them in their children’s education.
Content and Curriculum Expertise: Several principals highlighted the strong content knowledge of UNCG graduates. They noted that graduates are well-prepared in understanding and delivering curriculum content effectively and are able to align their teaching with state standards and curricular goals (including vertical alignment across grade levels to ensure continuity in student learning). One principal shared an example of a teacher who demonstrated exceptional content and curriculum expertise, reflecting, “So as far as curricular knowledge, how to plan the constraints of a lesson, all those things are taught here like she knows how to look at standards. She knows how to do those things.” Her strong grasp of the curriculum allowed her to implement a new literacy program, Youfly, and make it relevant and engaging for her students.
Student Learning: Many principals emphasized the graduates’ strong focus on student learning. They noted that graduates are adept at tailoring their instructional strategies to meet diverse needs, engage students, and differentiate instruction. This includes using innovative tools and methods to make learning more interactive and personalized. A principal reflected, “She adapts and goes the extra mile to make sure that our students have what they need.”
Several principals also highlighted the graduates’ efforts to support English Learners (ELs) through targeted instructional strategies and resources. A principal recounted a time that a graduate was working through engaging ELs in instruction, “She had them going in all the centers and I think that the program has helped her think about that—think about the needs of our Hispanic populations—or English Learners (ELs).” The principal noted that her ability to create engaging and differentiated learning experiences for her students was evident in her use of centers to support language development. She also organized ESL Family Nights to help families access resources, demonstrating a holistic approach to student and family engagement.
Reflection: Several principals described UNCG graduates as reflective and coachable, consistently seeking feedback and looking for ways to improve their practice. Graduates were noted for their receptiveness to coaching and their willingness to incorporate feedback into their teaching strategies.
One principal described their graduate as “definitely very reflective in her practice, she’s always going to the CF, asking how she could be better. And we’re providing her with feedback. But she’s very receptive of the feedback that we give her and making whatever adjustments that needs to be made.”
Adaptability and flexibility. Many school leaders praised UNCG graduates for their ability to adapt to different roles, grade levels, and teaching methods. This adaptability is crucial in meeting the diverse needs of students and adjusting to various educational environments. One interviewee reflected on the flexibility of her graduate, “She has taught English for me, Math and Science for me. And then this year, she works with my English as a Second Language (ESL) students.”
Use of technology. Several principals emphasized the graduates’ ability to integrate technology effectively, mentioning tools like Nearpod and AI applications, and to adapt instruction to meet student needs in both traditional and virtual settings. One teacher was praised for using the Magic School app to make virtual learning more creative and engaging.
Overall, the data suggest that UNCG graduates are entering the field with strong foundational skills across multiple standards and competencies. One interviewee shared, “UNCG does a very good job of preparing teachers with that strong background, in just good instructional practices, and they are thinkers and problem solvers too, with a strong student focus.”
Challenges teachers are facing. During the interviews, we inquired into the biggest challenges these teachers face, from the supervisors’ perspective. Teachers are currently navigating a complex landscape marked by emotional, systemic, and instructional challenges. A major concern across interviews was classroom and behavioral management, particularly with students experiencing poverty, trauma, or other socio-emotional stressors that manifest as distractions or disruptions. They also expressed difficulty engaging students in online settings, where home environments often introduce uncontrollable distractions that further complicate the learning process.
Systemic pressures, especially those stemming from the COVID-19 pandemic, continue to weigh heavily on educators. Learning loss, fluctuating attendance, and the need to manage multiple learning levels within a single classroom have intensified teacher workloads, according to our interviews. Compounding these issues is a reduction in resources such as tutoring support, as well as emotional burdens tied to changing family dynamics. Interviewees described parents as more reactive and less trusting, adding strain to teachers already working long hours and facing a broader societal trend of diminishing respect for the profession. Additional challenges include teaching multiple core subjects under stringent standards, working with highly transient student populations (especially English Learners), and coping with fatigue, low energy, or long commutes, all of which impact consistency, morale, and teacher-student relationships.
Based on school leaders’ perspectives, what improvements should be made to UNCG’s teacher preparation program to better support future graduates?
School leaders suggest that UNCG’s teacher preparation program could be improved by increasing exposure to high-need and diverse student populations, emphasizing adaptability and openness to innovation, enhancing classroom management and instructional strategy planning, integrating training for dual- exceptional and multilingual learners, supporting non-traditional teacher pathways, and offering mock interviews and job preparation experiences.
While many participants did not identify significant gaps in the graduates’ preparation and praised their overall readiness, some provided constructive feedback and suggestions for improvement. Several participants did not offer any criticism at all and were entirely positive about the preparedness of UNCG graduates. However, across a few interviews, principals pointed some areas for improvement, given the specific struggles the graduates in question faced and overall observations from their vantage point.
Based on the interview data, we have articulated the following areas for improvement and actionable recommendations for strengthening teacher preparation at UNCG.
Recommendations for strengthening UNCG teacher preparation
Enhance Classroom Management and Instructional Strategy Planning: Increase focus on classroom management strategies and instructional planning for differentiated, student-centered activities, including small group work and interactive learning experiences. One participant stressed this point around student-centered activities, such as small group work and interactive learning experiences. He shared, “Even your high-level kids, they want to do some smaller things so that it catches their attention better.”
Increase Exposure to High-Need and Diverse Student Populations: Ensure that graduates have opportunities to work in schools with diverse needs, including Title I schools, serving students with Exceptional Children (EC) needs, trauma histories, socioeconomic disadvantage, and Social Emotional Learning (SEL) needs.
One participant pushed the idea of practical experiences in diverse places, “I think putting them in real situations, putting them in schools like mine that have needs and not trying to hide them from the title one schools, the schools who have socioeconomic—the schools who have students with Exceptional Children (EC), because to be honest, after the pandemic, all schools are seeing an influx and they change in their population. So preparing them by letting them see the real, and not just textbooks. It’s because textbook examples of old are not our current reality when dealing with students.”
Emphasize Adaptability and Openness to Innovation: Foster a mindset of adaptability and openness to new tools and methods, especially with the rise of technology and artificial intelligence (AI) in education. A principal emphasized this, recommending explicitly teaching adaptability and openness to new tools and methods to enhance student engagement.
Integrate Training for Dual-Exceptional and Multilingual Learners: Provide more training and resources for working with students who have dual exceptionalities, such as gifted and learning disabled, and ESL. One participant reflected that current approaches are too siloed, failing to equip teachers with strategies that address intersecting student needs.
Support for Non-Traditional Teacher Pathways: From a school operating under a flexible licensure model, one participant recommended creating modular or targeted coursework for content experts without formal teacher training. This could include short-term hands-on training in pedagogy for individuals with subject-area degrees.
Offer Mock Interviews and Authentic Job Preparation Experiences: While noting overall preparedness, one principal recommended the addition of mock interviews and job-readiness support that encourages candidates to reflect deeply on their own philosophies and practices, moving beyond generic or rehearsed responses.
EPP Dashboard
The NCDPI’s EPP Dashboard is a comprehensive set of interactive data displays illuminating educator preparation in our state. The dashboard covers a number of topics, tracing candidates from enrollment to license exams to effectiveness in the classroom.